Using Ant Design table to display data having different numbers of columns for different rows


What if we have data object which has different number of values for different keys.
During my internship, I faced a problem where I need to display data which has different columns for different rows. So, in this article, I am going to discuss how I got the solution.
It is very difficult to display our data in a table form if our data has different number of values for different keys. Because for each row we have to write different code or logic to display in a tabular form. Let's take the following example:
let data = [{
            "key": "Rupesh",
            "data": [
                {
                    "id": 1,
                    "contact": 307425,
                    "timestamp": "2020-07-17 11:18:05",
                    "October": {
                        "Maths": "90",
                        "Science": "95"
                    },
                    "December": {
                       "Maths": "92",
                        "Science": "91"
                    },
                    "March": {
                       "Maths": "90",
                        "Science": "95"
                    },
                    "Result": "96"
                }
        ]
        },
        {
            "key": "Yash",
            "data": [
                {
                    "id": 2,
                    "contact": 310617,
                    "timestamp": "2020-07-17 11:19:15",
                    "December": {
                        "Maths": "92",
                        "Science": "91"
                        "Result": "90"
                    },
                    "March": {
                         "Maths": "93",
                        "Science": "94"
                        "Result": "92"
                    }
                },
            ]

        }]
If you can see in the above data, we have different number of columns for 1st data i.e for key Rupesh, we have extra column of October but which is not there for 2nd data i.e for key Yash. Apart from this, there are many difference in number of columns for both rows if you see carefully. I faced this situation during my internship. Although there data was different but I modified here. So I was really confused, how to display this kind of data. So, then I got the solution for this. I got to know about Ant Design table format.
What is Ant Design(antd) and how to use it in React.js project
It provide comprehensive design guidelines, best practices, resources, and tools to help designers produce high-quality product prototypes. They have developed a React UI library antd that contains a set of high quality components and demos for building rich, interactive user interfaces. To use this library in our React app. We need to install antd.
npm install antd
You can read more about antd and how to use its different components in our our react project through https://ant.design/docs/react/introduce .
Now let's see how we can use table component
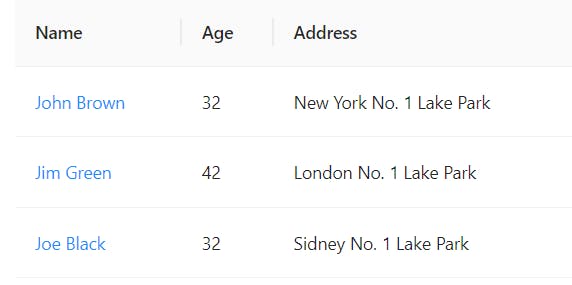
We are going to take example from the antd website and then we explore we can use its table component for our data. Specify dataSource of Table as an array of data.
const dataSource = [
  {
    key: '1',
    name: 'John Brown'
    age: 32,
    address: 'New York No. 1 Lake Park',
  },
  {
    key: '2',
    name: 'Jim Green',
    age: 42,
    address: 'London No. 1 Lake Park',
  },
  {
    key: '3',
    name: 'Joe Black',
    age: 32,
    address: 'Sidney No. 1 Lake Park',
  },
];

const columns = [
  {
    title: 'Name',
    dataIndex: 'name',
    key: 'name',
    render: text => <a>{text}</a>,
  },
  {
    title: 'Age',
    dataIndex: 'age',
    key: 'age',
  },
  {
    title: 'Address',
    dataIndex: 'address',
    key: 'address',
  },
];

<Table dataSource={dataSource} columns={columns} />;
So, the columns attributes decide how our table will be created and dataSource is for our data to display. This is how our table will look finally.
 For further details and explaination, you can refer different websites and youtube.
Now let's see the code for our solution
Here I am pasting the code of my solution for the problem I mentioned earlier in this article.
_expandedRow = (row) => {
        var columns = [];
    if (row.key === "Rupesh") {
            columns = [
                { title: 'contact', dataIndex: 'contact', key: 'contact' },
                { title: 'timestamp', dataIndex: 'timestamp', key: 'timestamp' },
                {
                    dataIndex: 'October',
                    key: 'October',
                    title: 'October',
                    render: (October) => {
                        if (October !== "") {
                            return <div>
                                Maths : {October.Maths}<br />
                                Science : {October.Science}
                            </div>

                        }
                        else {
                            return
                        }


                    }
                },
                {
                    dataIndex: 'December',
                    key: 'December',
                    title: 'December',
                    render: (December) => {
                        if (December !== "") {
                            return <div>
                                Maths : {December.Maths}<br />
                                Science : {December.Science}
                            </div>

                        }
                        else {
                            return
                        }


                    }
                },
                {
                    dataIndex: 'March',
                    key: 'March',
                    title: 'March',
                    render: (March) => {
                        if (March !== "") {
                            return <div>
                                Maths : {March.Maths}<br />
                                Science : {March.Science}
                            </div>

                        }
                        else {
                            return
                        }


                    }
                },
                { title: 'Result', dataIndex: 'Result', key: 'Result' },
            ];

            const data = [];
            if (compDatas !== {}) {
                for (let j = 0; j < row.data.length; ++j) {

                    data.push({
                        lineNo: row.data[j].contact,
                        timestamp: row.data[j].timestamp,
                        HipCenter: row.data[j].October,
                        MedialMalleolus: row.data[j].December,
                        LateralMalleolus: row.data[j].March,
                        HipCenterError: row.data[j].Result,
                    });
                }
            }
            return <AntdTable
                className="your-table"
                columns={columns}
                dataSource={data}
            />
        }
    else if (row.key === "Yash") {
            columns = [
                { title: 'contact', dataIndex: 'contact', key: 'contact' },
                { title: 'timestamp', dataIndex: 'timestamp', key: 'timestamp' },
                {
                    dataIndex: 'December',
                    key: 'December',
                    title: 'December',
                    render: (December) => {
                        if (December !== "") {
                            return <div>
                                Maths : {December.Maths}<br />
                                Science : {December.Science}<br />
                Result  : {December.Result}
                            </div>

                        }
                        else {
                            return
                        }


                    }
                },
                {
                    dataIndex: 'March',
                    key: 'March',
                    title: 'March',
                    render: (March) => {
                        if (March !== "") {
                            return <div>
                                Maths : {March.Maths}<br />
                                Science : {March.Science}<br />
                Result  : {December.Result}
                            </div>

                        }
                        else {
                            return
                        }


                    }
                },
            ];

            const data = [];
            if (compDatas !== {}) {
                for (let j = 0; j < row.data.length; ++j) {
                    data.push({
                        lineNo: row.data[j].contact,
                        timestamp: row.data[j].timestamp,
                        Tibia: row.data[j].December,
                        Femur: row.data[j].March,
                    });
                }
            }
            return <AntdTable
                className="your-table"
                columns={columns}
                dataSource={data}
            />
        }

    render() {
        let columns = [{
            dataIndex: 'key',
            key: 'key',
            title: 'Summary',
            render: (key) => {
                return {
                    children: <div>{key}</div>
                }
            }
        }
        ];

    return (
            <React.Fragment>

                        <Table
                            columns={columns}
                            dataSource={compDatas}
                            defaultExpandAllRows={true}
                            expandedRowRender={this._expandedRow}
                        />
            </React.Fragment>
        )
    }
}
In the render(), we are extracting the key value i.e Rupesh and Yash. And to represent the data inside of each rows, we have written a method _expandedRow() method, and it will automatically be called with the help of defaultExpandAllRows={true} and expandedRowRender={this._expandedRow}. In the _expandedRow(), I have written if-else condition to create different columns for different rows. It is self explanatory. If anyone has any issue with the above code or did not understand, they can comment the query, I will try to explain. Thanks for the reading.